Security investments are often justified by fear: a breach could happen, and it would be expensive. Finance directors have heard that argument many times, and they are right to ask for more. A business case for just-in-time access can do better, because most of its value does not depend on a breach happening at all. Standing privilege costs money every quarter — in engineer time spent waiting for access, in platform time spent granting it, in audit effort spent defending it, and in tools that overlap.
This post sets out the four sources of value, the costs to set against them, and a simple model you can fill in with your own numbers. It deliberately contains no claimed savings figures from customers. Where it uses an example, the inputs are hypothetical and labelled as such; replace them with yours before showing the result to anyone.
In short
- Four value lines: reduced breach exposure, engineer and platform time, audit and review effort, and overlapping tools you can retire or avoid.
- Three of the four are measurable without a breach. Build the case on them; treat breach exposure as the upside, not the foundation.
- Costs are mostly people, not licences. Rollout effort, approver time and the operation of a small broker in your network.
- The model is transparent arithmetic. Every input is a number your own teams can measure or estimate and defend.
- Agree the outcome measures up front: standing administrators left, time to access, review hours and audit findings on access.
Why a fear-based case fails
The classic security business case multiplies an industry breach cost by a guessed probability and a guessed reduction. Each guess is defensible on its own; the product of three guesses is not. A finance team that pushes on any one of them will find that the number could be ten times larger or ten times smaller, and the case loses credibility.
A stronger approach separates value into the parts you can measure today and the part you cannot. Engineer time, audit hours and tool spend can be measured before and after. Breach exposure can be described honestly — how many people could take over the production payments account today, and how many after the programme — without pretending to know the probability of an attack.
fewer standing admins,
narrower grants"] V --> T["Engineer and platform time
faster access,
fewer tickets"] V --> A["Audit and review effort
records by default,
prepared reviews"] V --> L["Tool spend
overlap retired
or avoided"] B --> BM["Described, not priced:
standing admins left"] T --> TM["Measured:
hours per month"] A --> AM["Measured:
hours per audit cycle"] L --> LM["Measured:
contracts and renewals"]
Build the case on the three measurable lines; present breach exposure as the risk reduction it is, not as a guessed saving.
Value line one: breach exposure
Credentials are among the most common ways attackers get in, and the damage they can do is set by the access the credential holds at that moment. That is the risk argument, and it is a sound one. The industry figures are useful context for the board, as long as they are presented as context.
data
IBM’s Cost of a Data Breach study put the global average cost of a breach at roughly US$4.9 million in its 2024 edition, with breaches involving stolen or compromised credentials among the slowest to identify and contain. The Verizon Data Breach Investigations Report has repeatedly listed the use of stolen credentials among the leading initial actions in breaches.
Sources: IBM Security / Ponemon Institute, Cost of a Data Breach Report 2024; Verizon DBIR (multiple years). Averages hide wide variation by sector, region and size.
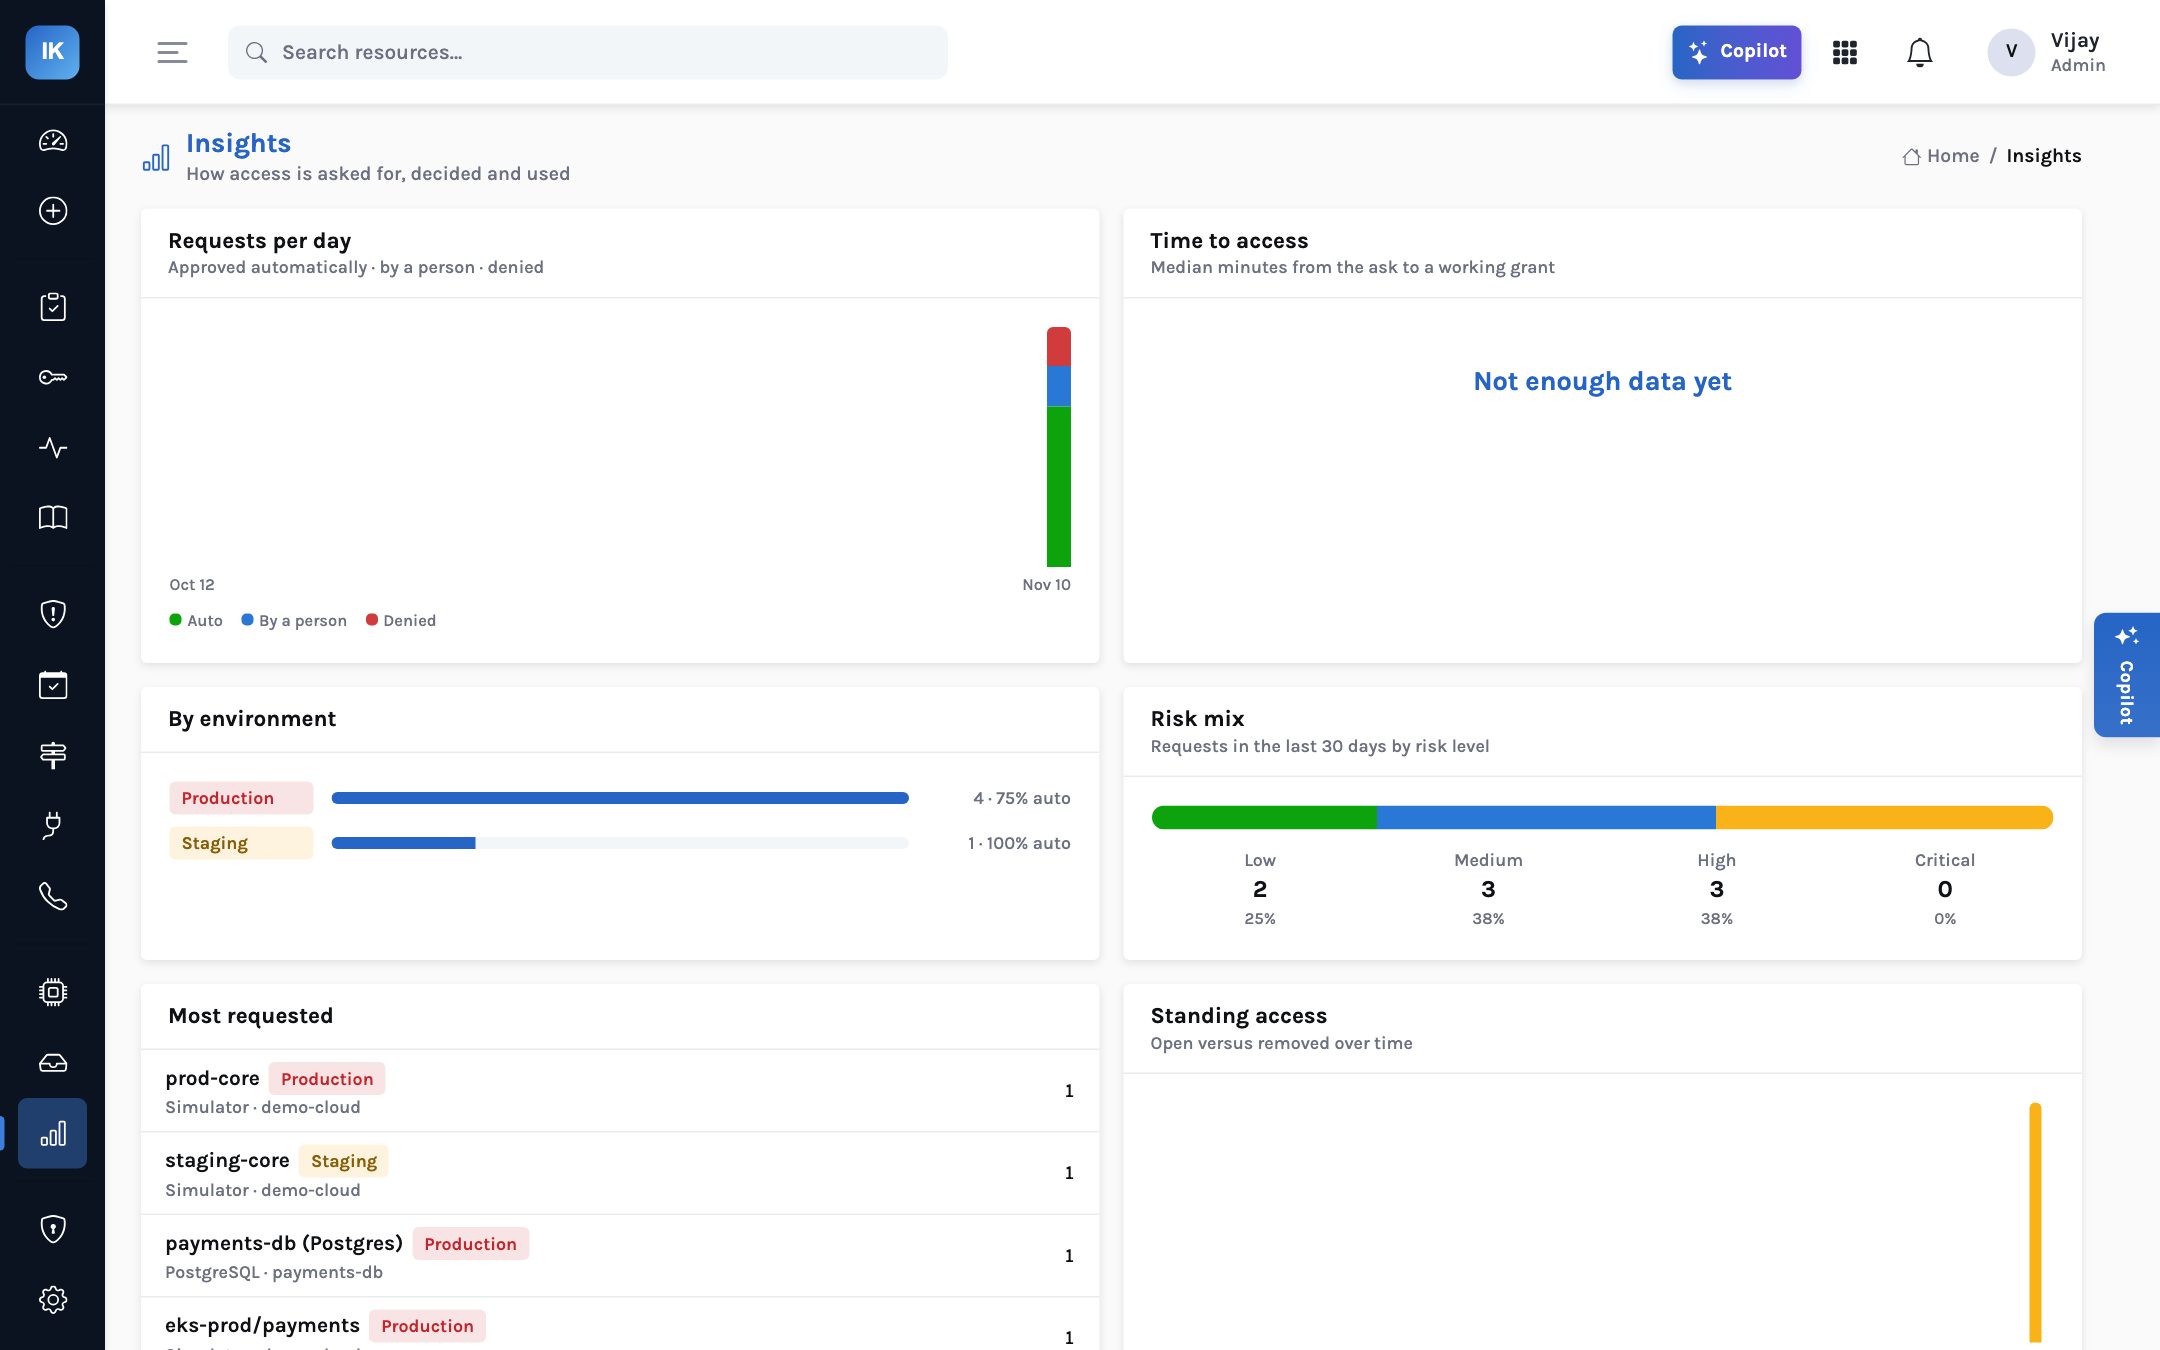
The defensible way to use this is not to claim a share of the average as a saving. It is to show the exposure itself shrinking. Before the programme: a list of named people and roles who could, if compromised, take over each critical system. After: a shorter list, each remaining entry justified, and every other privileged grant limited to a task, a scope and an hour or two. In the demo organisation used in our screenshots, discovery found four standing administrators, one escalation path and a never-used database superuser on the systems that hold payment data. That list is what the board should see shrink.
Value line two: engineer and platform time
Access requests are an interruption tax paid twice: by the engineer who waits and by the platform or security engineer who grants. In many organisations, a production access request means a ticket, a manager’s approval, and a person who makes the change by hand — and later another person who is supposed to remove it.
Just-in-time access with risk-based routing changes that cost in two ways. Low-risk requests, where the access flow allows it, are approved in seconds without a person. And no request needs a platform engineer to make the change, because the broker in your network creates the scoped grant and removes it at expiry. The people who remain in the loop are approvers on the requests that deserve a human decision.
Value line three: audit and review effort
Audits of access controls are expensive mainly because evidence has to be gathered. For a sample of grants, someone finds the ticket, the approval in chat or email, the change in the cloud console, and proof of removal. Periodic access reviews are worse: spreadsheets are exported, distributed, chased and reconciled, and reviewers approve lines they have no evidence to question.
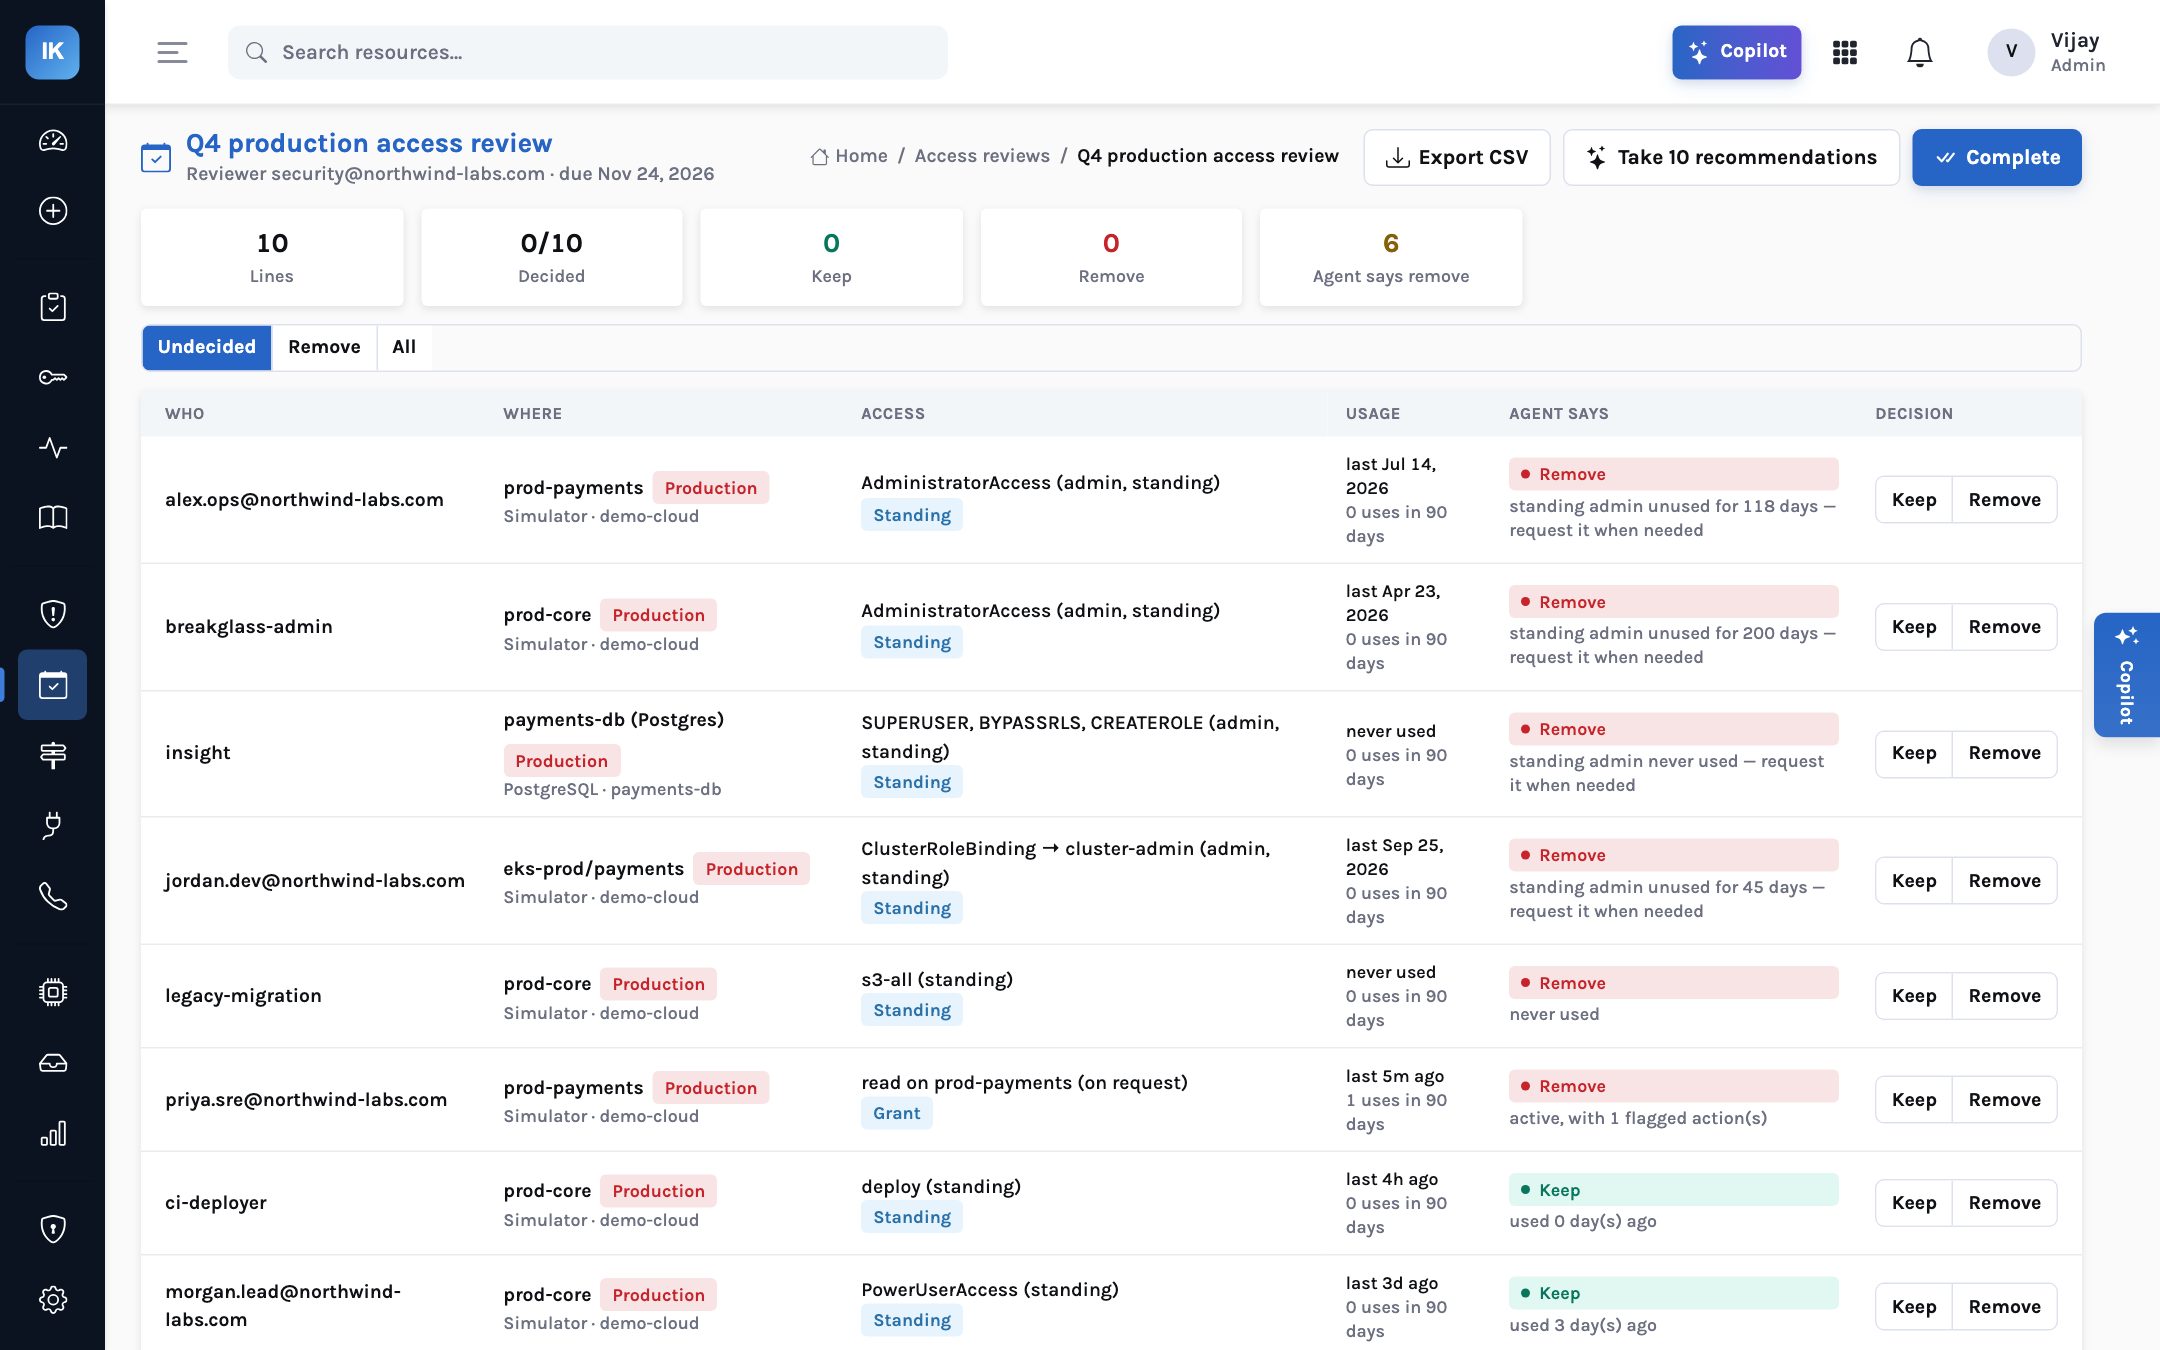
When every grant is a record from request to removal, sampling becomes a lookup. When review lines arrive pre-filled with last use, uses in ninety days and a recommendation, the reviewer’s job is a decision per line, and removal happens through the broker from the same screen. Evidence can be exported to InsightAssure, VerticalServe’s compliance product, or as CSV.
Value line four: tools you can retire or avoid
This line varies most between organisations, and it should be counted carefully. Some will find overlap: a home-built access request bot, a separate review tool, scripts that grant and remove temporary roles, or licences bought for a feature that the new programme covers. Others will find none, because their privileged access management suite vaults credentials and records server sessions that just-in-time access does not replace. Count only what you would really switch off, and when the renewal date actually falls.
The costs to set against it
A credible case states its costs fully. For just-in-time access, licences are rarely the largest line. InsightKeys is priced per engineer who can request access, not per resource; contact us for a quote. The other costs are:
| Cost | What it involves | How to estimate |
|---|---|---|
| Rollout | Installing the broker, connecting single sign-on, building the catalogue and access flows, moving teams one by one | Platform and security days per team moved |
| Broker operation | A small service in your network (docker run or Docker Compose today), with its credential and local policy | Hosting is modest; the real cost is ownership and patching |
| Approver time | Requests above the auto-approve threshold still need a person | Requests per month above threshold × minutes per decision |
| Change management | Engineers lose access they held for years; trust has to be earned | Time for communication and support in the first weeks of each team |
| Coverage gaps | Systems outside the 1.0 integrations still need their own process | Count privileged systems not on AWS, PostgreSQL or Kubernetes |
A worked model you can adapt
The model below is arithmetic, not a forecast. Every input is something your teams can measure or estimate. The example column uses hypothetical inputs for an imaginary organisation, to show the calculation; it is not a benchmark and not a result from any customer.
| Input | How to get it | Hypothetical example |
|---|---|---|
| A. Privileged access requests per month | Count tickets or chat requests for production access | 400 |
| B. Minutes an engineer waits per request today | Median from ticket timestamps | 180 |
| C. Minutes of platform effort per request today (grant + removal) | Sample and time a few | 20 |
| D. Share of requests that could be auto-approved at low risk | Classify a month of past requests | 60% |
| E. Hours per access review cycle (all reviewers and coordinators) | Last cycle’s effort | 160 |
| F. Hours of audit evidence gathering for access per year | Ask the people who did it | 120 |
| G. Loaded cost per engineering hour | From finance | Use your own figure |
A × C ÷ 60 hours. The broker makes and removes grants, so most of this effort goes. Example: 400 × 20 ÷ 60 ≈ 133 hours a month.
A × D × B ÷ 60 hours for auto-approved requests. Example: 400 × 0.6 × 180 ÷ 60 = 720 hours. Count only a fraction as productive time recovered, and say what fraction you used.
Estimate what share of E remains when lines are pre-filled with usage and recommendations. Use a conservative share and state it.
Estimate what share of F remains when every grant is a record from request to removal.
Only contracts you will actually end, from their real renewal dates.
Rollout, approver time for requests above the threshold, broker ownership, change management and licences.
Multiply hours by G to convert them to money, and present year one separately from the steady state, because rollout effort falls in the first year. Then present breach exposure alongside, not inside, the total: the count of standing administrators and escalation paths before, and the target after.
Be conservative, and say so
Waiting time is the largest number in most models and the easiest to overstate: an engineer waiting for access is often doing something else. Count a modest fraction, state it, and let the finance team adjust it. A case that survives scrutiny at half its headline is stronger than one that collapses at the first question. We do not publish savings figures because we have no customer results to base them on yet.
Presenting it to the board
For the CISO
Lead with exposure, not money: how many people could take over each critical system today, and the target in two quarters.
Then show the operating case: time to access and audit effort, measured before and after a first team.
For the platform lead
Run the first team as a measured pilot. Record time to access, platform hours and requests by route for a month before and a month after.
Use those real numbers to replace the hypothetical inputs before the case goes further.
For the board
Ask for two things each quarter: the count of standing administrators left, and the time it takes an engineer to get access. The first should fall and the second should stay short.
Treat the breach figures as context for why the first number matters, not as a promised saving.
The strongest case for just-in-time access does not depend on predicting a breach.
It rests on time and effort you can measure this quarter, presented beside a list of standing privilege you can watch shrink.