Boards are asked to oversee cyber risk, and access is where much of that risk sits. Yet the access numbers that reach a board pack are usually activity figures: tickets closed, reviews completed, accounts provisioned. They show that a team is busy. They rarely show whether the organisation is less exposed than it was last quarter, and several of them can improve while exposure gets worse.
This post proposes a short set of access metrics to report upward, a longer set to keep inside the security team, and a precise definition for each so that it cannot quietly be gamed. It uses the demo organisation, Northwind Labs, to show where each number comes from in InsightKeys.
In short
- Report exposure, not activity. Standing administrators left, privilege-escalation paths open and the share of production access that is time-bound tell a board whether risk is falling.
- Pair every speed metric with a safety metric. Time to access and the automatic-approval rate are good for engineers, and both can be improved by loosening controls.
- Define each number so it cannot be gamed. Count identities, not accounts; count effective admin, not role names; count removals that the broker confirmed, not decisions.
- Keep operational numbers inside the team. Request volume, flags and agent proposals guide the work; they do not belong in a board pack without context.
- Five board metrics, one page, a trend line each. More than that and nobody reads them.
Why access metrics mislead
Most access reporting grew out of ticketing. The natural units are requests and tickets, so the natural metrics are counts and cycle times. Those numbers matter to the people running the service, but they answer the wrong question for a board. A board wants to know: if someone in our organisation had their credentials stolen tonight, how much damage could the attacker do, and is that getting better?
data
Stolen or misused credentials are consistently reported among the leading ways breaches begin, and the average cost of a data breach is measured in millions of US dollars: IBM’s 2024 report put the global average at roughly US$4.9 million. What a stolen credential can reach at the moment it is used is a large part of what determines where an incident lands in that range.
Sources: Verizon Data Breach Investigations Report (annual editions); IBM / Ponemon Institute, Cost of a Data Breach Report 2024. Figures vary by year, sector and region.
Three common metrics look good while that answer gets worse.
| Metric that looks good | How it can improve while risk rises |
|---|---|
| Access requests closed within SLA | Grant broader roles so people stop needing to ask. Fewer requests, all fast, more standing access. |
| Share of requests approved automatically | Raise the threshold or widen the flow. More automatic approvals, less scrutiny of risky ones. |
| Access reviews completed on time | Reviewers click Keep on every line. 100% completion, nothing removed. |
| Number of privileged accounts | Move administrators into groups or shared break-glass accounts. The count falls; the people who can act as admin do not. |
None of these is a bad metric. Each is incomplete, and each is safe to report only beside a second number that would move the other way if it were being gamed.
The five metrics for the board
The set below is short on purpose. Each measures exposure or control, has a direction everyone understands, and can be produced from records rather than surveys.
| Metric | Precise definition | Target direction | Why it resists gaming |
|---|---|---|---|
| Standing administrators left | Identities (people and machine roles) with effective admin on production that is always on, after discovery | Down to a small, named, justified set | Counted from discovery of effective permissions, not role names, so renaming or moving to a group does not reduce it |
| Open privilege-escalation paths | Identities that are not admin but hold a known route to it, e.g. iam:PassRole with compute creation | Zero outside break-glass | Computed from policies, not self-declared |
| Time-bound share of production access | Of all production access used in the period, the share that came through a time-limited grant rather than standing access | Up | Falls if standing access is quietly re-granted |
| Median time to access | Median minutes from the ask to a working grant | Down, within a set ceiling | Reported beside the share auto-approved at high risk, which must stay at zero |
| Review removals confirmed | Lines removed in access reviews that the broker confirmed revoked, as a share of lines the evidence said should go | Up, and reviewed for overrides | A review where every line is kept shows up immediately |
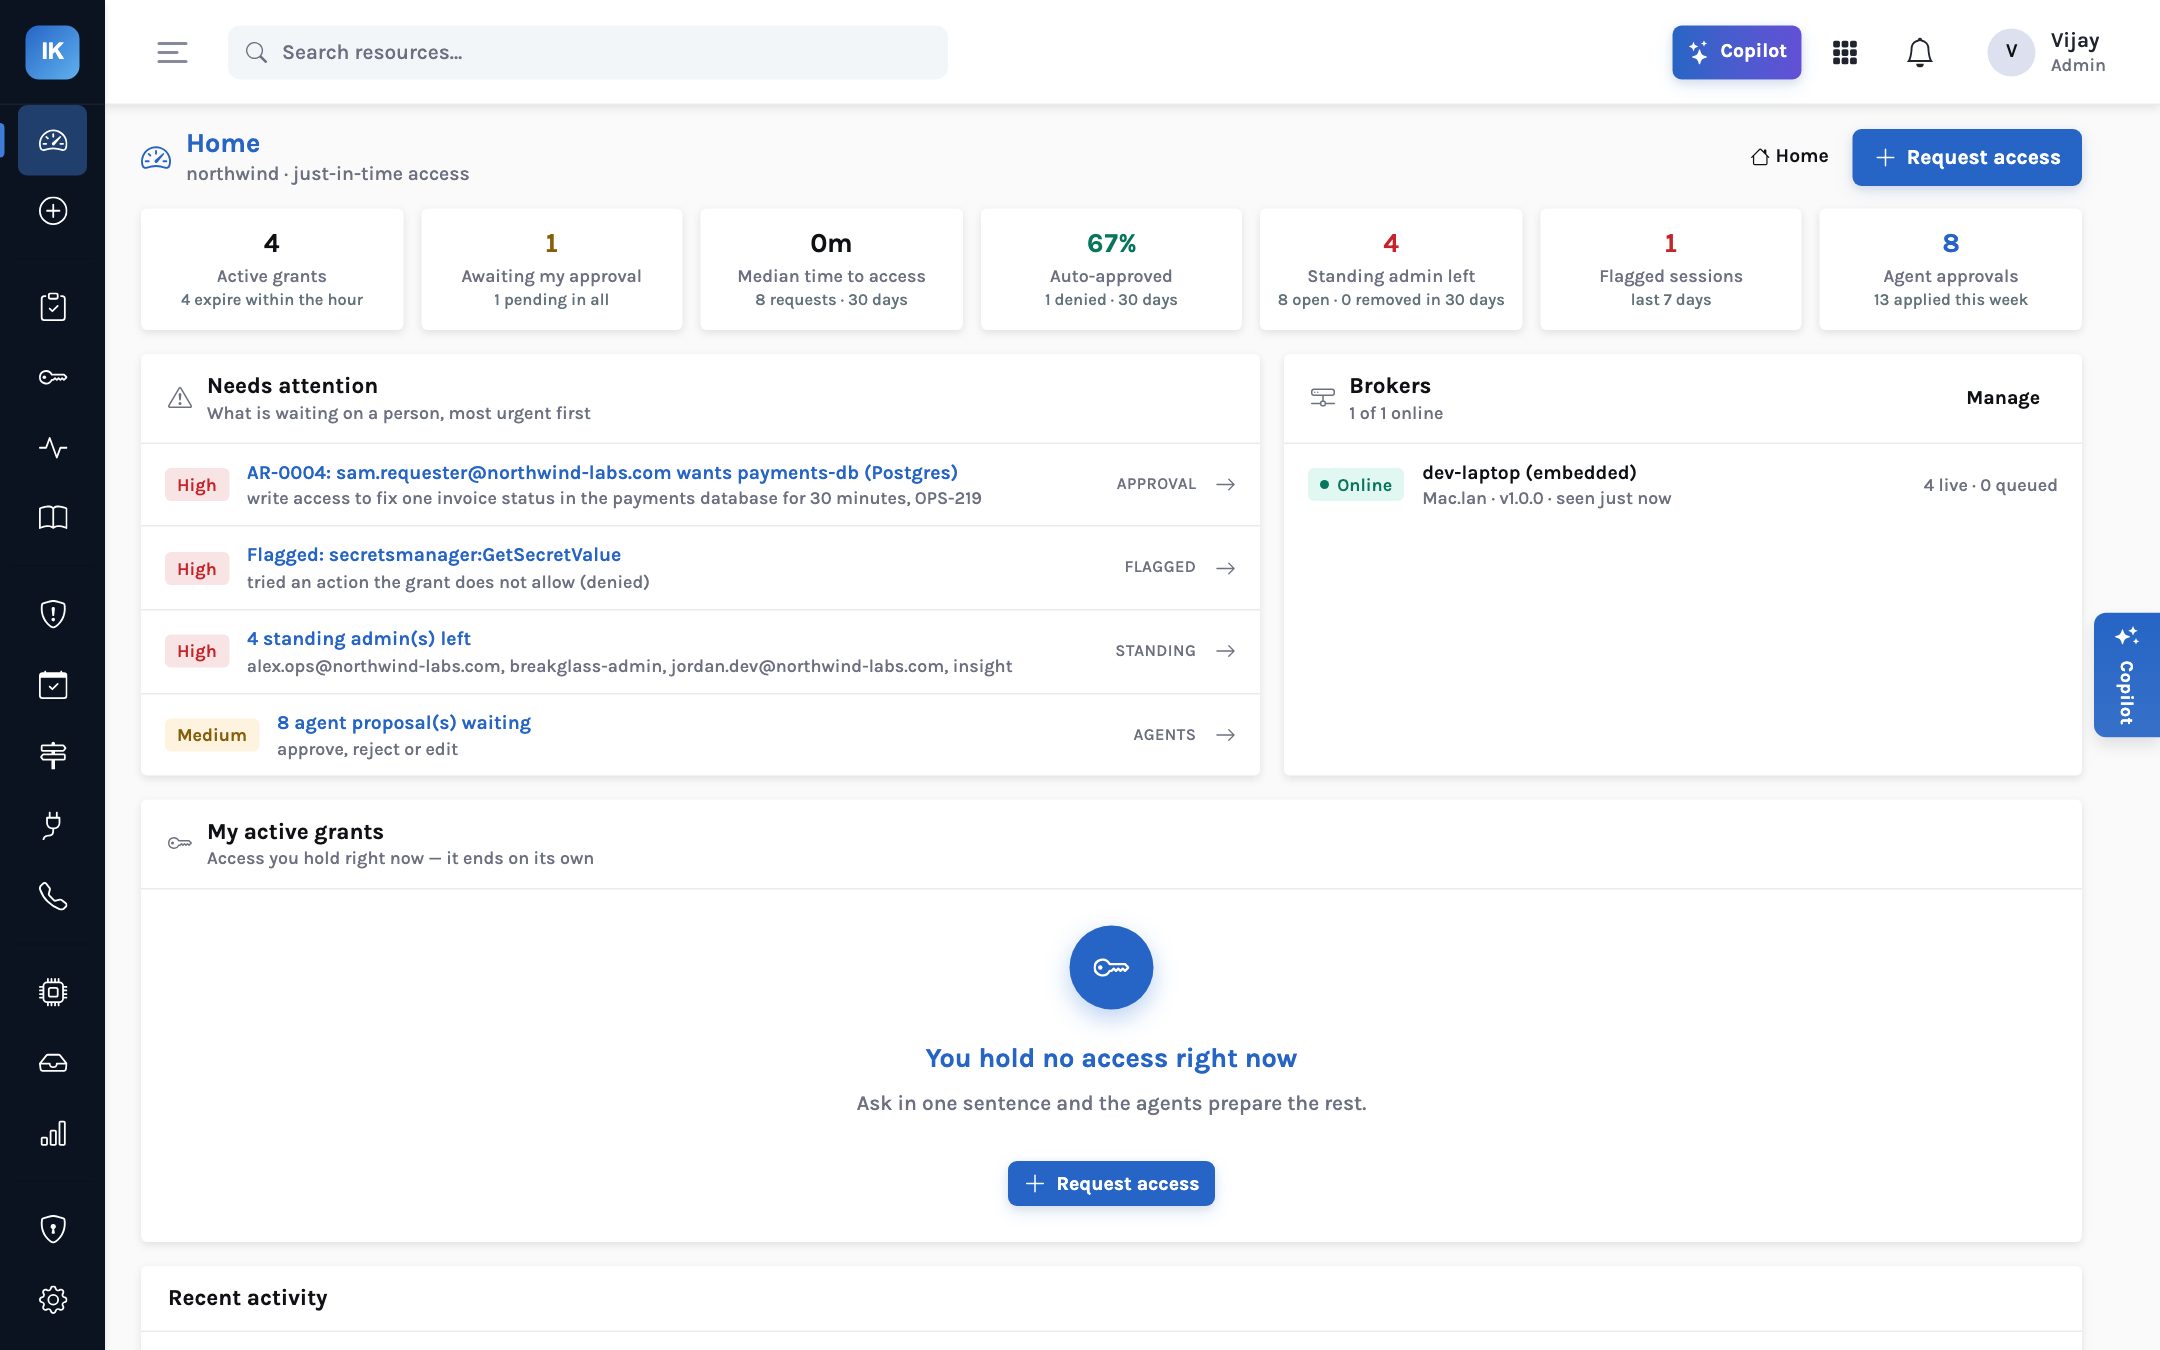
In the demo organisation, discovery found eight open standing-access items: four standing
administrators, one escalation path and two roles unused for more than 90 days. The four admins are
named on the standing access page: alex.ops with AdministratorAccess on prod-payments,
unused for 118 days; breakglass-admin with AdministratorAccess on prod-core, unused for
200 days; jordan.dev with cluster-admin on eks-prod/payments; and the
insight database role with SUPERUSER, BYPASSRLS and CREATEROLE on payments-db, never
used. The escalation path is the ci-deployer role on prod-core, which can pass a role
to a new Lambda function and invoke it. Those are the first two board numbers: 4 and 1. The board
question for next quarter is how many remain.
Pairing speed with safety
Engineers judge an access programme by how long they wait. If the answer is “longer than before”, they will campaign for standing access and they will often win. So time to access belongs in the board set, but never alone.
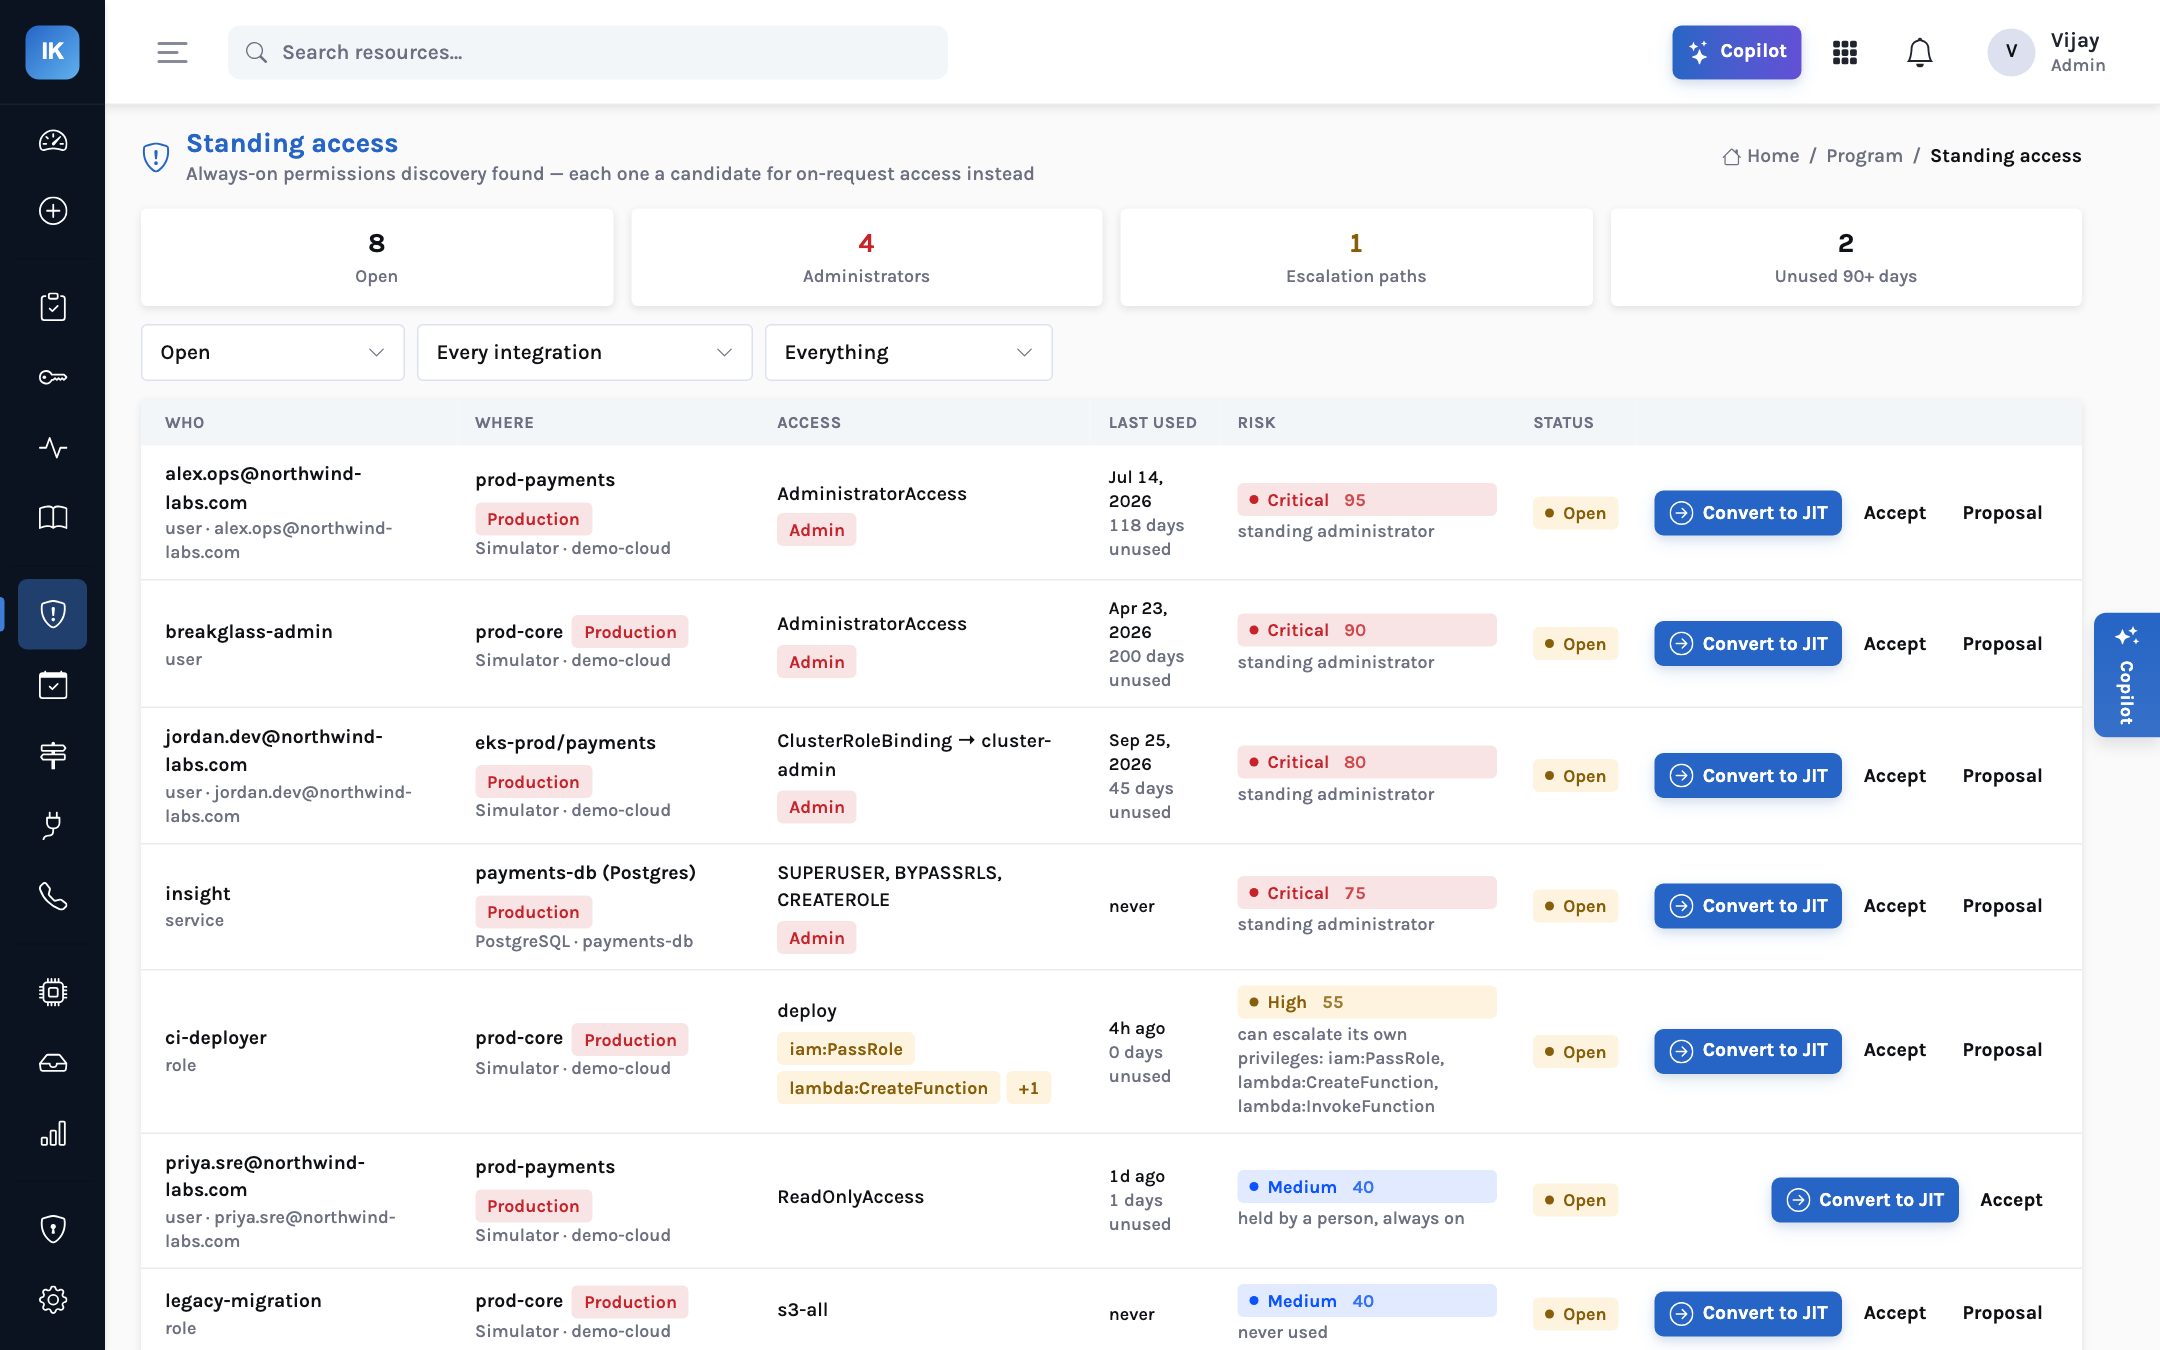
67% sounds efficient. It says nothing about which requests were automatic, and it rises if someone widens a flow.
The share automatic at Low and Medium risk can rise. The share automatic at High and Critical should be zero unless a flow explicitly allows it, and any exception is named.
The pairs that matter:
| Speed metric | Paired with | What a bad pairing looks like |
|---|---|---|
| Median time to access | Requests approved automatically at High or Critical risk | Time falls because risky requests are no longer reviewed |
| Share approved automatically | Risk mix of requests (Low, Medium, High, Critical) | Auto share rises while the mix shifts toward High |
| Fewer requests per engineer | Time-bound share of production access | Requests fall because standing access came back |
| Reviews completed on time | Review removals confirmed | Completion at 100%, removals near zero |
Illustrative placement. Activity metrics move up only when paired with an exposure metric.
What stays inside the security team
Some numbers are essential for running the service and confusing in a board pack. Requests per
day, split into approved automatically, approved by a person and denied, show load and approval
behaviour. Most-requested resources show where to invest in better ceilings or flows. Flagged
sessions — in the demo, one, Priya’s denied secretsmanager:GetSecretValue
call during a log-reading grant — are important individually but meaningless as a trend
without the story behind each. Open agent proposals measure the cleanup backlog.
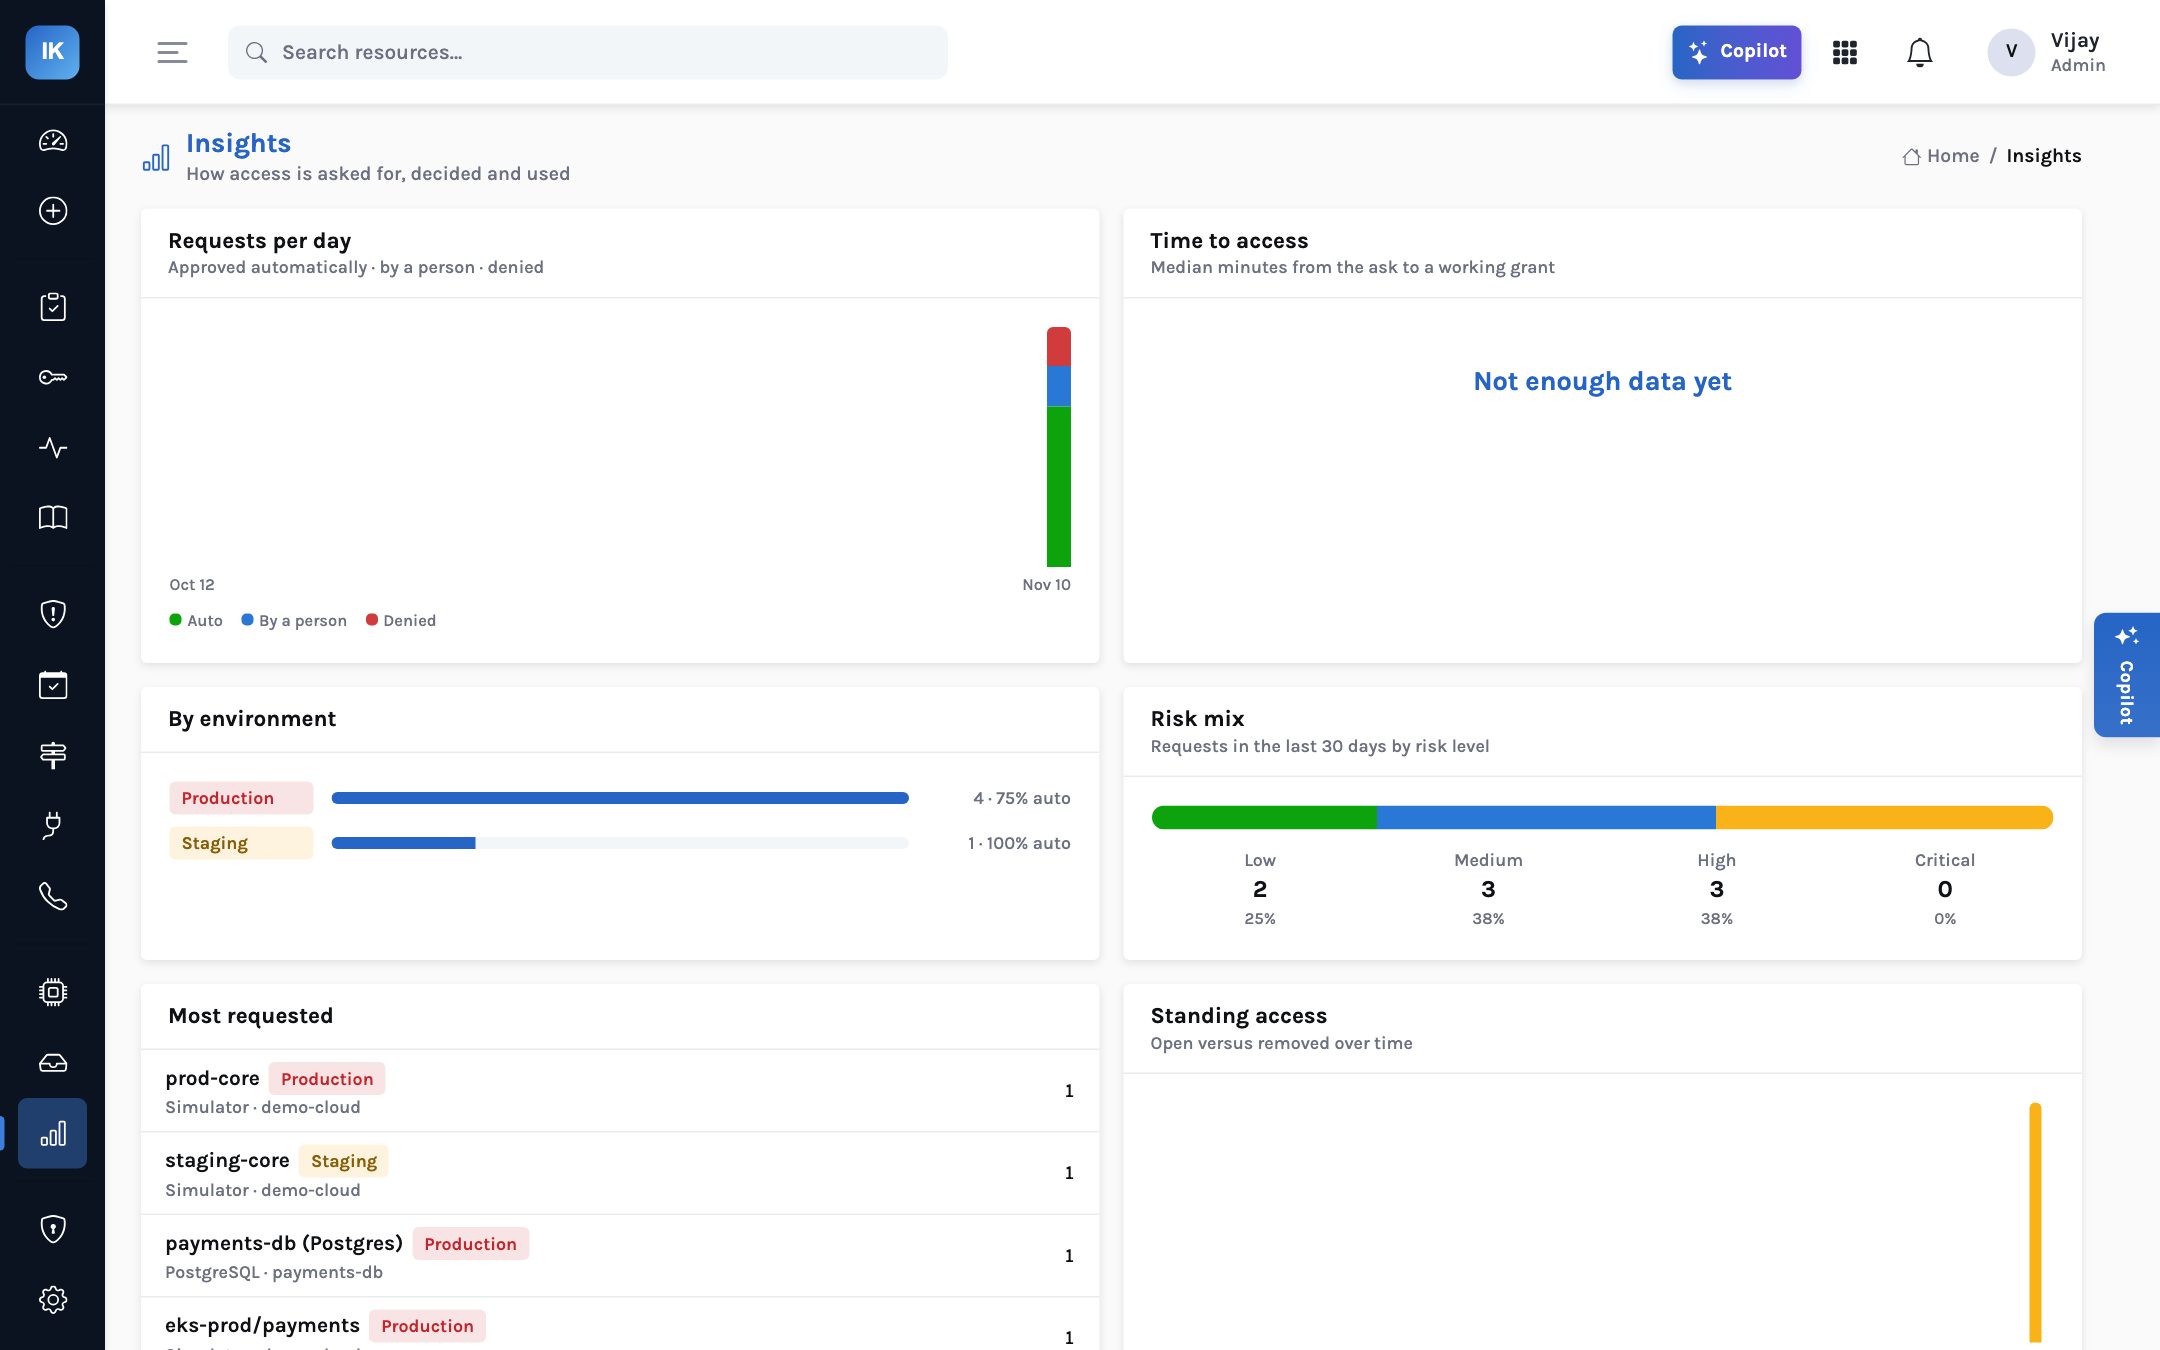
The risk mix deserves a mention. In the demo’s last 30 days, 8 requests split 2 Low, 3 Medium, 3 High and 0 Critical. The security team should watch whether that mix is stable. A rising High share can mean engineers are asking for broader access, or that a new production system has arrived without good ceilings. Both are worth a conversation; neither is a board item until it becomes a trend.
Definitions that hold up
Most metric disputes are definition disputes. Before the first board page goes out, settle four questions in writing.
Identities, not accounts. A person with admin in three AWS accounts is one standing administrator with three exposures, or three items? Either answer is defensible; changing between them is not. Pick one, and count machine roles separately from people, because their remedies differ: a person’s standing admin becomes on-request access, a machine role’s becomes a narrower role.
Effective, not nominal. A role called “deploy” that can pass a role to
a new Lambda function and invoke it is, for practical purposes, an administrator. The demo’s
ci-deployer is exactly that. Counting from discovered permissions rather than names is
what makes “escalation paths open” a separate and honest line.
Confirmed, not decided. A review decision to remove access is an intention. The broker’s revocation is the fact. Count the second, and report the gap between the two if there is one.
Accepted is not removed. Some standing access will be kept on purpose: a break-glass account held under seal, a pipeline role that genuinely needs broad rights. Report those as accepted, with the reason and the person who accepted them, rather than dropping them from the count. An auditor or a new CISO will ask, and the answer should already be written down.
Targets follow from the definitions. A reasonable first-year ambition for many organisations is to bring standing administrators on production down to a small accepted set, to close every escalation path outside break-glass, and to hold median time to access steady or better while doing it. The specific numbers belong to each organisation; what matters is that they are set before the work starts, not chosen afterwards to fit the result.
One page for the board
A board access page that works has five lines, each with a current value, last quarter’s value, a target and one sentence of commentary. It does not have heat maps or 40 KPIs.
Agree the five definitions above with the audit committee once. Changing a definition later is reported as a change, with both values shown for one quarter.
Before any cleanup, record standing admins, escalation paths and unused roles. This is the number the programme is judged against.
Standing access from discovery, time to access and approvals from Insights, review removals from the review campaign and its CSV export.
What moved and why. “Two standing admins converted to on-request access; one accepted with a named reason.”
Every speed number goes in with its safety partner, or not at all.
For the CISO
Five exposure-led numbers give a defensible answer to “are we less exposed than last quarter?”.
Paired metrics protect the programme from its own success: a faster service cannot hide looser control.
For the platform lead
Operational numbers stay where they are useful: running flows, tuning ceilings and clearing the cleanup backlog.
Definitions come from records the platform already holds, so producing the page is minutes, not a project.
For the board
Standing administrators left is the single clearest measure of how much a stolen credential could do.
A falling number with stable or better time to access means the organisation is safer without slowing down.
What the numbers cannot tell you
Every metric here is only as complete as discovery. InsightKeys discovers AWS accounts and IAM, PostgreSQL roles and Kubernetes bindings today; Google Cloud, Azure, MySQL, MongoDB, Snowflake and GitHub are on the roadmap. Standing access in systems it does not yet cover will not appear in the count, so the board page should say which estates are in scope. The time-bound share is worked out from the grant records and the standing access list; it is not a single tile in the console today. And a small number is not automatically a good one: an accepted standing admin needs a reason that someone has written down and will review.
Measure how much a stolen credential could do, and whether that is falling.
Report standing admins, escalation paths and the time-bound share of production access upward; keep the activity numbers for the team, and never show a speed metric without its safety partner.